Preface
I originally wrote this article between February and March 2025, but due to my relocation from Berlin to Zurich, I never managed to publish it on time. The analysis and data presented here were part of my own research to guide investment decisions earlier this year. Interestingly, as I reviewed the content in late 2025, I found that most of the trends and conclusions have largely held true, reinforcing the value of these observations. For that reason, I believe it’s still worth sharing now — both as a reflection on how the global economy has evolved and as a reminder of how enduring certain economic dynamics can be.
Introduction
As the international community is facing one crisis after the other and the political tensions seem not to be de-escalating any time soon (see Trump expansion plans), it is natural to assume that complicated times for the economy lie ahead, especially when some important indicators are pointing to the wrong direction.
The economy overall is an extremely complicated bundle of variables and equations that make it’s exact predictability nearly impossible. Therefore, economists try to make assumptions based on the most important present indicators and compare it to similar scenarios from the past, however, this is indeed a challenging tasks, as post-industrial economies are always changing, as well as the trends in the political world and in technology, which also influence productivity and market behaviour. Nevertheless, we still try to make our best to have a grasp of our economy (that’s why we’re economists, right?) by analysing the variables we have at hand and use our economic intuition.
One of the most closely watched warning signals in macroeconomics is the inverted yield curve — a phenomenon that occurs when short-term government bond yields rise above long-term yields, indicating that investors expect slower growth or even a downturn ahead. Historically, this indicator has been remarkably accurate: every major U.S. recession since the late 1950s has been preceded by an inversion of the yield curve, typically 6 to 18 months before the downturn began.
In mid-2022, the U.S. Treasury yield curve inverted once again and has remained inverted through 2024 and into early 2025, marking one of the longest inversion periods on record. This persistence has prompted renewed debate among economists and investors about whether a recession is inevitable — or whether structural changes in monetary policy and global capital flows have weakened the signal’s predictive power.
To explore this question, I will examine 10 key economic indicators — ranging from GDP and consumer spending to housing, trade, and public policy — to assess how they align with or contradict what the yield curve is currently suggesting. This holistic approach should provide a clearer picture of whether the market is indeed heading toward a contraction, or whether the traditional signals are evolving in our new economic landscape.
Analysing 10 Economics indicators
According to J.P. Morgan (2024), there are 10 main economic indicators to measure the health of an economy. We could theoretically write several articles about each of these indicators, but we’ll focus on a brief definition, the present state and the main variables affecting it’s predictability, so they can be used as the base to assess how accurate our market prediction is.
1. Gross domestic product (GDP)
Measures the total value of goods ad services produced in an economy. Can be calculated by using the following equation: Consumption + Investment + Government spending + Net Exports.
According to Statista (2025) for the GDP growth of the countries that comprise the G20, the annual growth has been on a slow downtrend since 2020, however, with the exception of Germany, we have still seen a sustainable growth within the G20 countries. The countries with the highest GDP growth in 2024 are on the upper part of the chart.
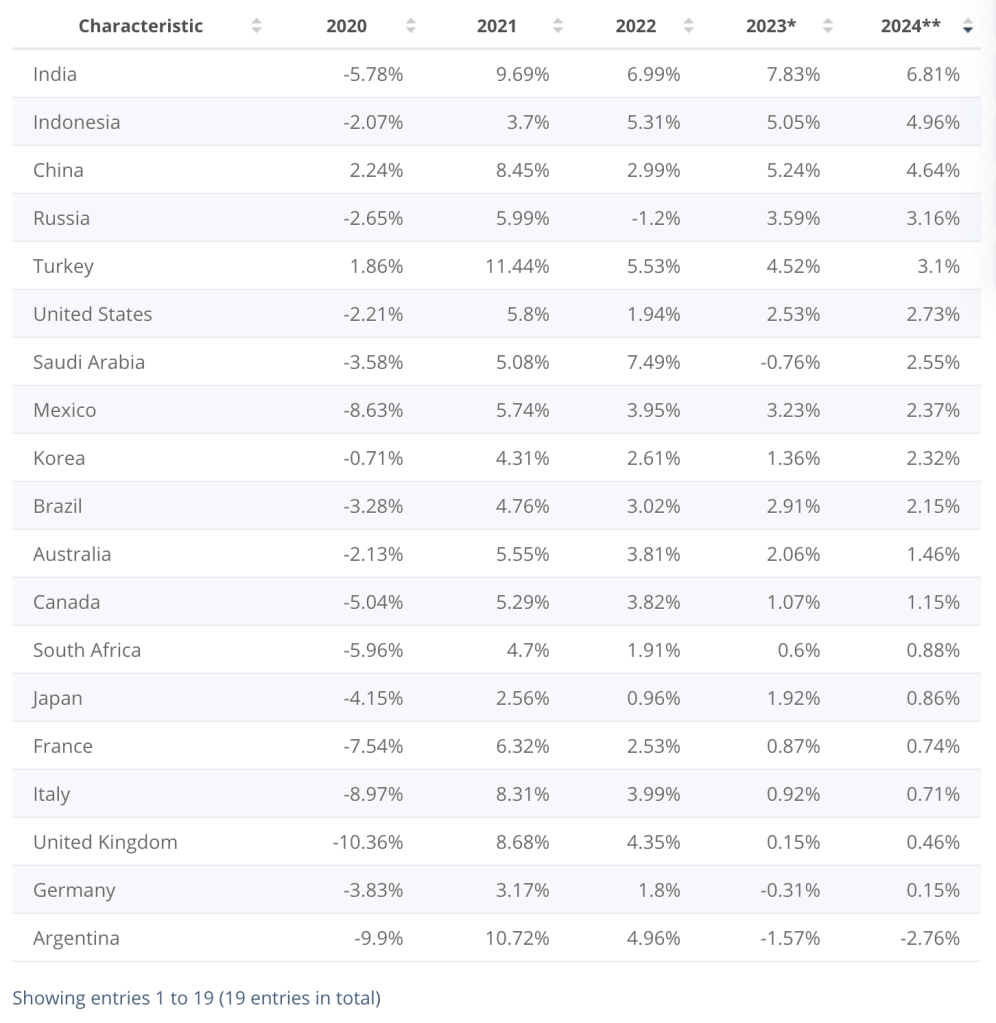
Trading Economics (2025) – Gross domestic product (GDP) growth of G20 countries from 2020 to 2024, by country (2025)
2. Consumer spending (CS)

Trading Economics (2025) – Consumer Spending G20 countries.
With the exception of Argentina, Australia and Indonesia, all other G20 countries have increased their consumer spending.
An increase in consumer spending is healthy for an economy, as it shows how consumers are engaged with the market. However, this change of consumer spending is partially driven by inflation. For instance, real consumer spending (consumer spending after counting in inflation) between January 2018 until August 2024 increased around 17% for households earning more than 100.000 USD. Middle income households, i.e. those households earning between 100.000-60.000 USA a year, rose by 13.3% during that same period, but for households earning less than 60.000 USA a year, CS role only by 7.9%. Rugaber, C (2024)
Considering households spend around 90-95% of their disposable income (income after taxes), this increase of real consumer spending means that households are saving less and spending more on goods and services, like Housing, Food, Transportation, Healthcare and entertainment. This is also the reason why consumer spending of low income households have not risen as much, as they were already on the lower end of the saving bracket, which usually account to the remaining 5-10% of disposable income.
We’ll come back to consumer spending to compare its influence on the economy together with other variables, like unemployment rate, stock market performance and the housing market.
3. Unemployment rate
One key factor for measuring the strength of an economy is to see how the labor force is doing in an economy. A low unemployment rate increases consumer spending, as more people are earning wages. However, a very low unemployment rate is not achievable in a capitalistic economy, as the labor market improves in some sectors more rapidly than in others and labour has an incentive to change. Additionally, there is a natural rate of companies that will go bankrupt and successful companies also like to hire new employees. Based on these facts, a healthy economy should have something between 3-5% unemployment rate, to maximise efficiency. Saez, E. and Michaillat, P. (2022). This becomes even more apparent when we take a look at the following chart comparing the unemployment rate to the amount of vacancies in the market:
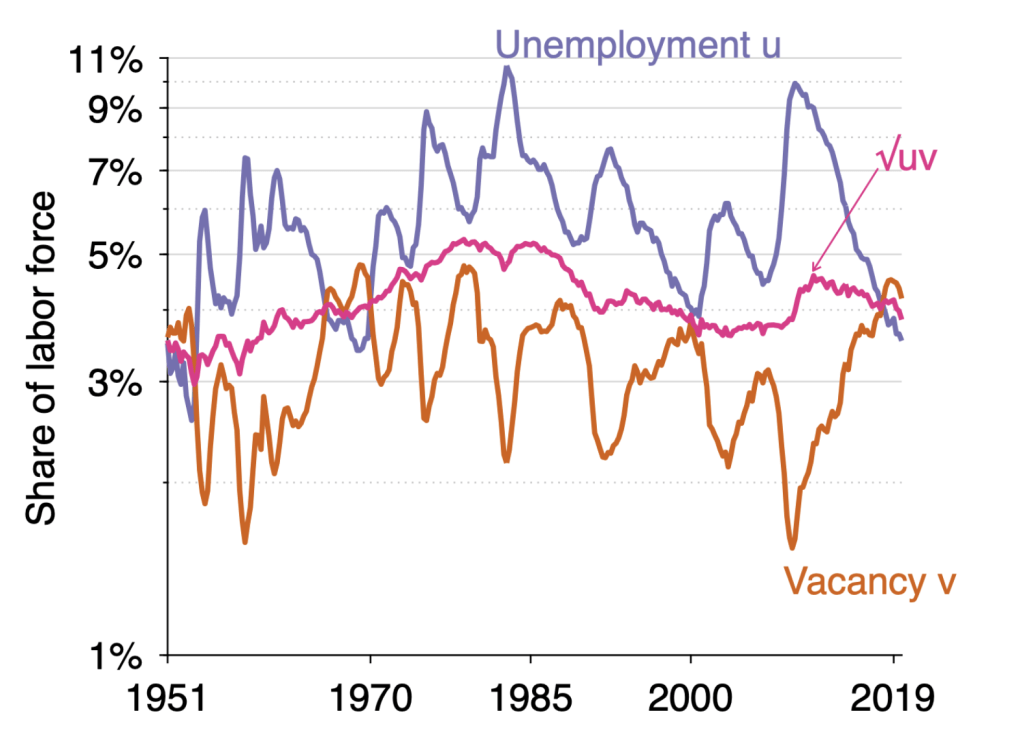
Saez, E. and Michaillat, P. (2022). The efficient unemployment and vacancy rate in the US, 1951-2019
We can see how in time of low unemployment, the number of vacancies in the market surpasses the amount of labor force available. This create an inefficiency in the market that makes companies labour under-skilled employees or it increases the costs for hiring to disproportionate amount, i.e. by increasing the bargaining position for new candidates, hence adding inflationary costs for companies.
Here we have a look at how G20 countries are performing in terms of unemployment rate in 2024:
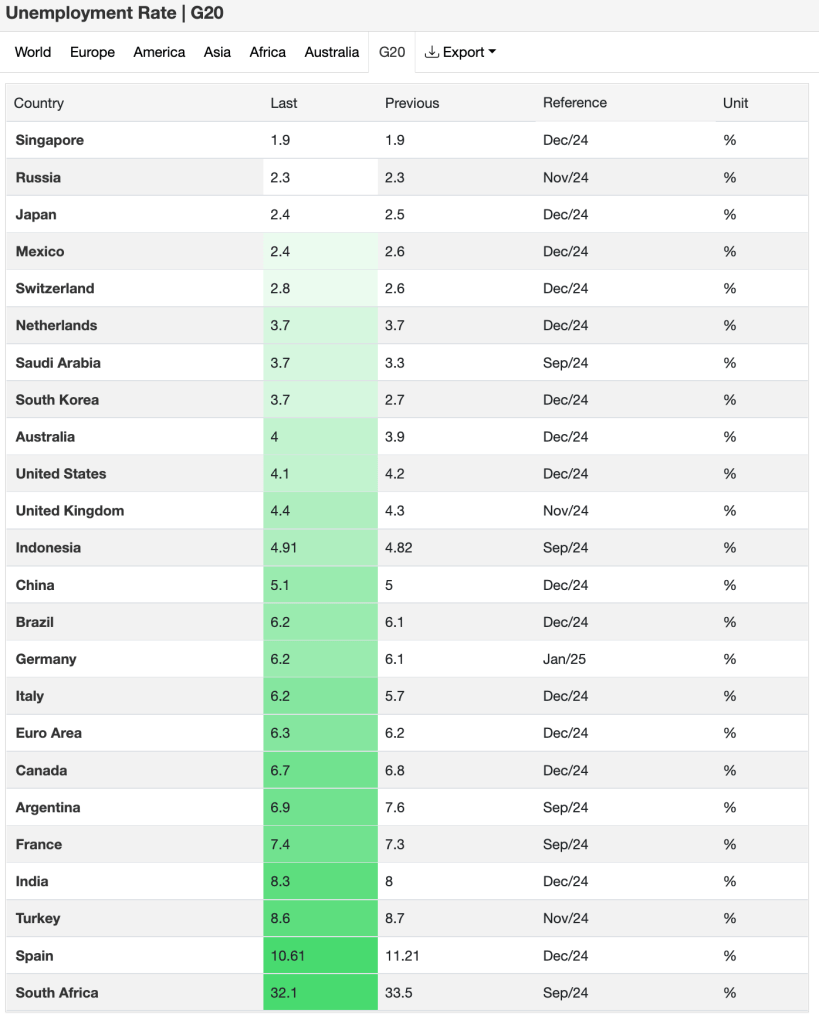
Trading Economics (2025) – Unemployment rate G20 countries
We can see that most big economies have a somewhat healthy unemployment rate and they have shown resilience in times of uncertainty, like during the covid pandemic. Around half of the economies are considered in a healthy unemployment rate. Exceptionally high unemployment rates (higher than 10%) are only seen in Spain and South Africa.
4. Interest rates
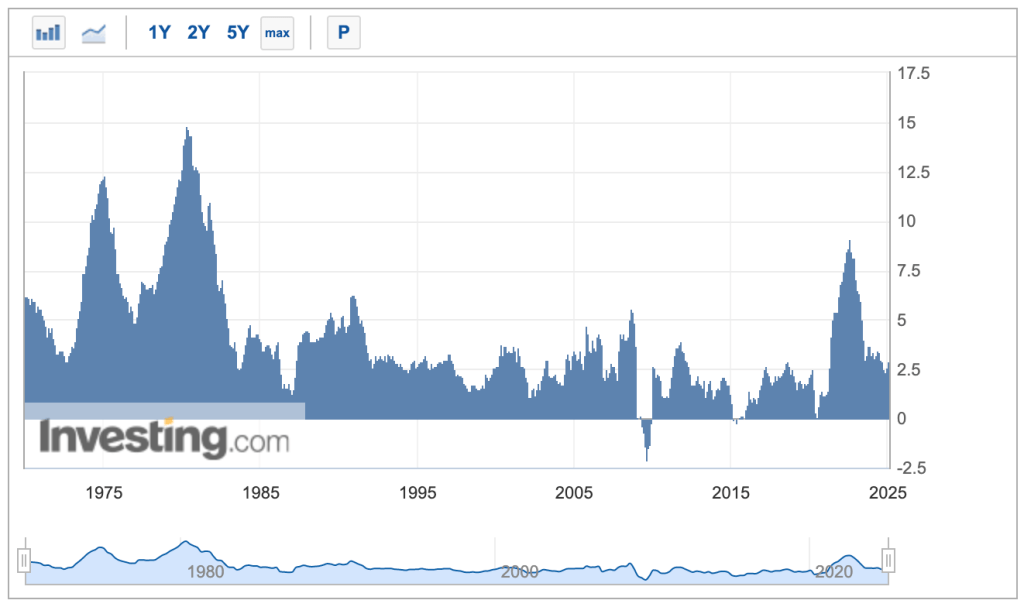
During the covid pandemic most advanced economies loosened their monetary policy by keeping interest rates low and increasing their money supply. This lead to high levels of inflation in the following years, which is the reason most advanced economies are now combating inflation by having high interest rates (Hutchinson, J. and Mee, S., 2025). Let’s have a look at the interest rate development from the US:
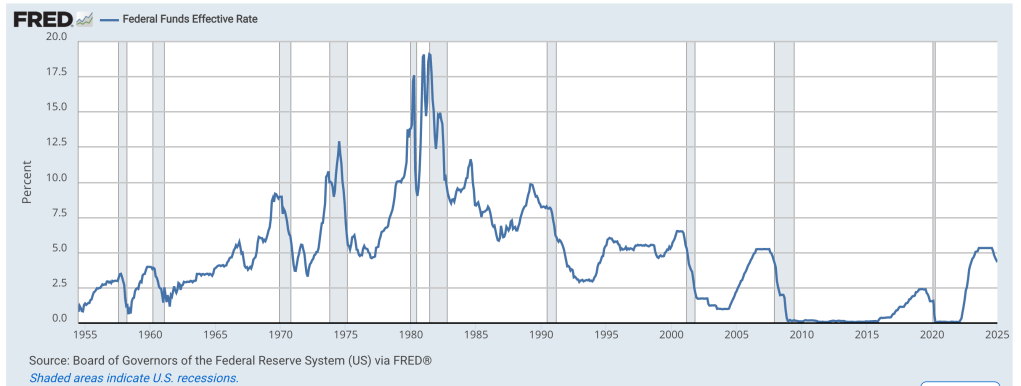
Federal Funds Effective Rate 1955-2025 (2024)
Now we can see that interest rates have exploded to pre-2008 levels, which makes money expensive to borrow and makes investments harder, especially from low-income households.
If we consider again the G20 nations, we see that interest rates sit higher than 4% for most countries, although they are trending back down slowly since 2023.
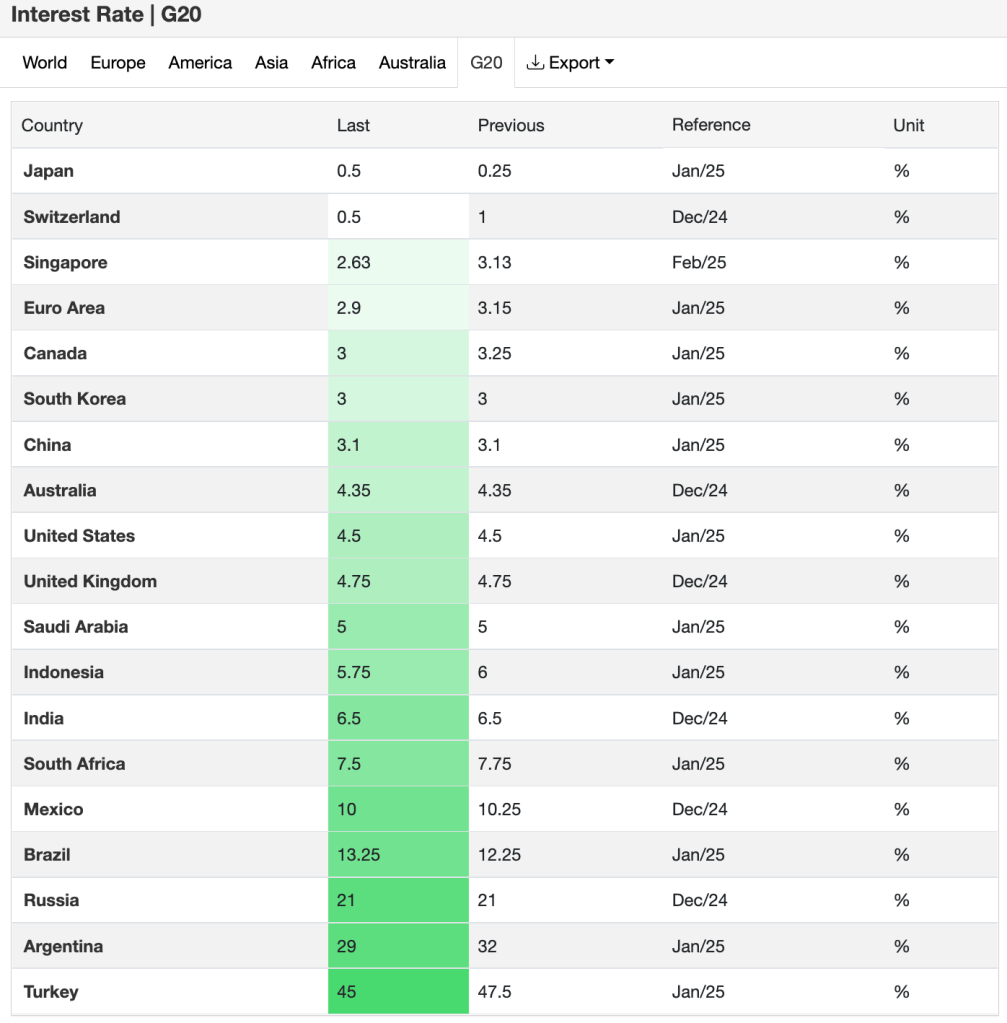
Trading Economics (2025) – Interest Rate G20 countries
5. The Consumer Price Index (CPI)
The CPI is used to measure inflation and as an indicator of the effectiveness of government economic policy. It is a measure of the average change over time in the prices paid by consumers for a market basket of consumer goods and services. The goods and services inside the basket are often changed to adapt for changes in consumer’s behaviour.
Here we have a look a look at the historical data. Notice how inflation spiked in 2021-2022. This level of inflation is inly comparable to levels of inflation during the 70s, but it has now become again stable at around 3%.
US Bureau of Labor Statistics (2025)
6. Business Confidence Index
This indicator is based on surveys done about the expectations on Production levels, New orders, Employment trends, General economic conditions, Profitability, expectations. Numbers above 100 indicate positive expectations, whereas numbers bellow 100 indicate a pesimistic view from the surveyees. The following graph show the BCI of G20 countries compared to the BCI of the USA.
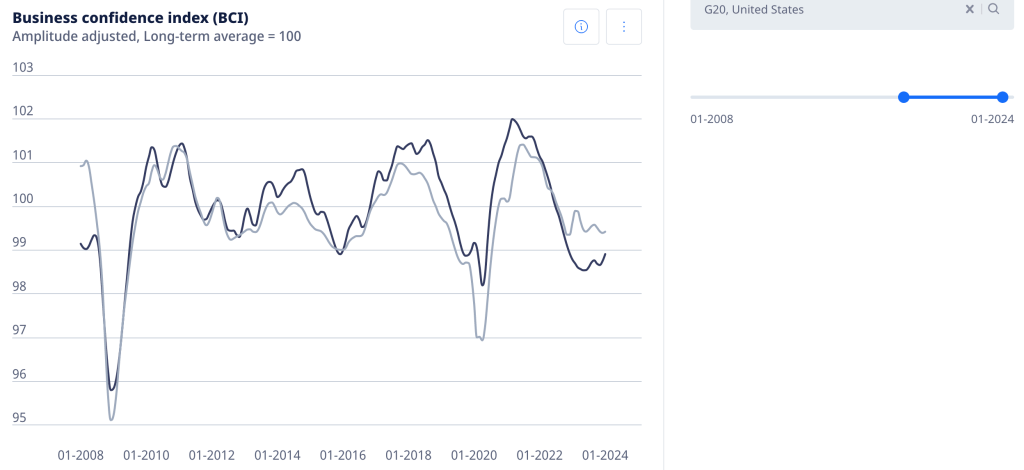
Organization for Economic Cooperation and Development (2025). Business Confidence Index (BCI) – G20 vs USA
Notice how during the global financial crisis and during the covid crisis confidence levels dip dramatically. We can see in the graph that confidence levels seem to be in a local bottom from its peak in 2021-2022.
7. Stock market performance
The stock market is one of the most visible indicators of economic sentiment and investor expectations. Although it can often be driven by speculation or short-term movements, in the long run it tends to reflect market confidence, earnings potential, and monetary policy direction.
The S&P 500 Index has shown remarkable resilience in the aftermath of the pandemic and subsequent inflationary period. Despite elevated interest rates and persistent geopolitical uncertainty, the index reached new nominal highs in early 2025, supported mainly by the strong performance of technology, AI, and robotics companies. This upward trend reflects investors’ confidence that innovation-led sectors will continue to drive productivity and profitability, even in a slower-growth environment.
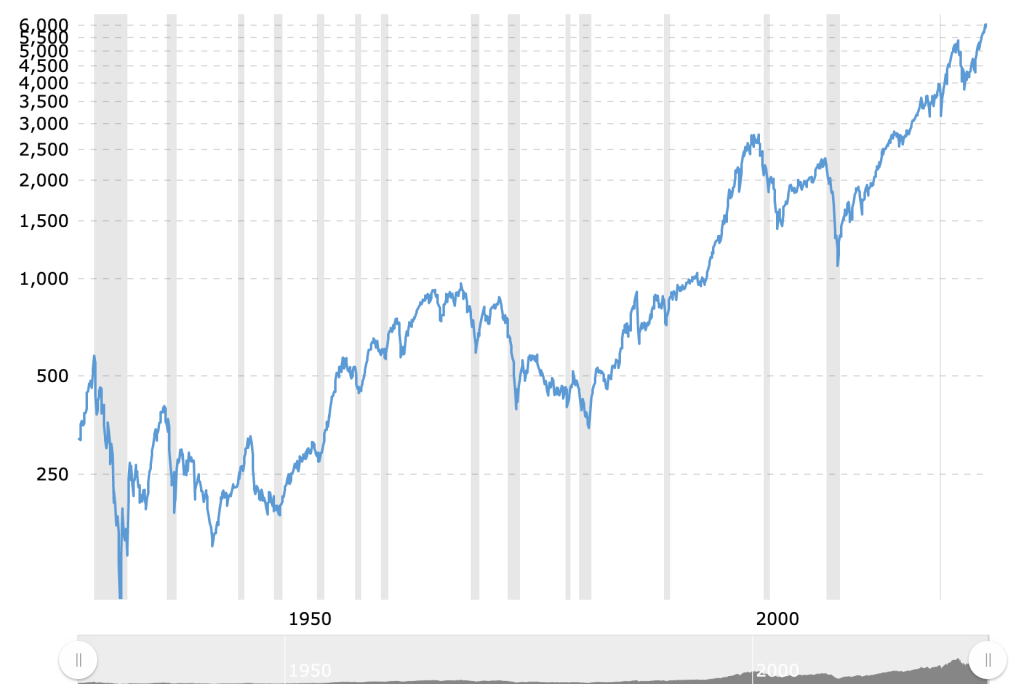
Macrotrends (2025) S&P 500 Index – 90 Year Historical Chart
The MSCI World Index — which tracks global equity markets — shows a similar pattern of recovery and stabilization. After the correction experienced in 2022, the index regained momentum through 2023 and 2024, driven largely by U.S. and Asian equities. European markets, on the other hand, have trailed slightly due to industrial stagnation and energy-related challenges, though selective sectors such as green technology and advanced manufacturing have performed relatively well.
Easyvest (2025) Historical performance of the MSCI World Index
Overall, global equity markets in 2025 continue to demonstrate optimism about technological innovation while cautiously navigating macroeconomic headwinds. This divergence between market enthusiasm and mixed economic fundamentals suggests that investors remain focused on the long-term transformative potential of technology — particularly AI and automation — as key drivers of growth.
8. Trade balance
The trade balance represents the difference between a country’s exports and imports of goods and services. A positive balance (surplus) means exports exceed imports, while a negative balance (deficit) indicates the opposite. A sustained deficit may suggest high domestic demand and strong currency value, whereas a surplus often reflects competitive industries and solid export performance.
According to Trading Economics (2025), G20 countries display significant divergence in their trade positions. Nations like Germany, China, and South Korea continue to post large surpluses, driven by their strong manufacturing and technology sectors. On the other hand, the United States, India, and the United Kingdom maintain persistent deficits, reflecting both robust consumer demand and reliance on imported goods.
Trade balance trends also mirror geopolitical and supply chain dynamics. The post-pandemic reshoring of production and ongoing tensions between China and Western economies have led to fragmented global trade patterns. Moreover, increased protectionism and regional trade blocs are slowly reshaping global value chains — a phenomenon economists now term “slowbalization”.
In short, the trade balance is not merely a measure of export performance, but a lens into how global dependencies and industrial competitiveness evolve over time.
9. The housing market
The housing market is a central component of economic health — influencing household wealth, construction activity, and financial stability. Rising housing prices often signal strong demand and consumer confidence, but if they rise too rapidly, they can lead to affordability crises and speculative bubbles.
Data from OECD and Trading Economics (2025) show that after the post-pandemic boom, housing prices have started to stabilize or even decline slightly in advanced economies like Canada, Germany, and Australia. High interest rates have cooled down mortgage demand, while elevated construction costs and regulatory bottlenecks continue to limit supply.
In the United States, for instance, the Case-Shiller Home Price Index still stands roughly 35% above pre-pandemic levels, but monthly growth has slowed considerably since mid-2023. Conversely, emerging economies like India and Indonesia have seen continued growth in housing investment, largely driven by urbanization and demographic expansion.
Housing market corrections can act as a pressure valve for inflation but may also constrain consumer spending, as households reduce borrowing and discretionary expenses. Thus, the health of the real estate sector remains a delicate balancing act for central banks aiming to maintain both price and financial stability.
10. Public policy and regulations
Fiscal and monetary policies play an overarching role in shaping all the indicators mentioned above. Government spending, taxation, subsidies, and regulation not only influence economic cycles but also determine the distributional effects of growth.
Since the pandemic, most advanced economies have adopted a dual policy stance: maintaining relatively tight monetary policy to combat inflation while introducing targeted fiscal interventions to support strategic sectors (such as renewable energy, AI, and semiconductor manufacturing). For example, the U.S. Inflation Reduction Act and the EU’s Green Deal Industrial Plan reflect a new era of industrial policy focused on long-term competitiveness rather than short-term stimulus.
Regulatory trends also play a growing role in determining economic resilience. Stronger ESG (Environmental, Social, and Governance) standards, digital privacy frameworks, and corporate transparency laws are becoming key differentiators of sustainable growth. The challenge for policymakers will be balancing innovation and stability — ensuring that new technologies like AI, automation, and biotechnology enhance productivity without amplifying inequality or market concentration.

10-Year Treasury Constant Maturity Minus 2-Year Treasury Constant Maturity (2025)
Conclusion
When we observe all these indicators together — from GDP and consumer spending to unemployment, trade, and housing — we see a global economy navigating a phase of structural transition. The resilience shown by labor markets and corporate earnings contrasts with persistent geopolitical instability, high borrowing costs, and uneven wealth distribution.
Despite the complexity and interdependence of these variables, one overarching insight emerges: the world economy remains adaptable. Periods of volatility often sow the seeds for transformation — new industries, trade routes, and consumption models.
So, what does this tell us about the inverted yield curve — the indicator that has historically preceded nearly every US or global recession within 6 to 18 months? Based on the current spreads between short- and long-term U.S. Treasury yields, the ongoing inversion may signal a potential recessionary phase emerging between late 2025 and mid-2026. Nevertheless, as with all economic forecasts, both the timing and severity of such a downturn remain uncertain, particularly within the unique post-pandemic policy environment and amid rapid technological transformation.
In the end, we can only remain attentive and adaptive, recognizing that markets often defy expectations. The role of economists and investors alike is to interpret data with discipline but also with humility — understanding that models can guide us, but never fully predict a future shaped by innovation, policy shifts, and human behavior
My personal opinion, you ask? I do believe the world is heading toward a short-term recession aligned with the Inverted Yield Curve indicator, but I also think that emerging technologies such as artificial intelligence and robotics are reshaping the global market in ways that could offset many traditional economic challenges. These technologies are truly transformative, and in my view, they will help keep markets dynamic and ultimately strengthen economic fundamentals, paving the way for a relatively swift recovery and continued value creation in the years ahead.
I’m not particularly worried about political instability itself, though I am curious to see how these technological and economic trends might respond to shifts in geopolitical tensions or potential conflicts. So far, it seems that global aggressiveness has remained largely contained — or at least, that’s what I like to believe
Thanks for reading,
Verdi
References
Board of Governors of the Federal Reserve System (US), Federal Funds Effective Rate [FEDFUNDS], retrieved from FRED, Federal Reserve Bank of St. Louis; Available at: https://fred.stlouisfed.org/series/FEDFUNDS (Accessed 04 February 2024)
Camille Van Vyve (2025). What is the MSCI World Index and how can I buy it? Easyvest. Available at: https://www.easyvest.be/articles/en_US/Post/msci-world-index (Accessed 04 Februrary 2025)
Consumer Spending G20 countries (2025). Trading Economics. Available at: https://tradingeconomics.com/country-list/consumer-spending?continent=g20 (Accessed 28 January 2025)
Federal Reserve Bank of St. Louis (2025). 10-Year Treasury Constant Maturity Minus 2-Year Treasury Constant Maturity [T10Y2Y], retrieved from FRED, Federal Reserve Bank of St. Louis. Available at: https://fred.stlouisfed.org/series/T10Y2Y, (Accessed 20 January 2025)
GDP Annual Growth Rate (2025). Trading Economics. Available at: https://tradingeconomics.com/country-list/gdp-annual-growth-rate (Accessed 20 January 2025)
Gross domestic product (GDP) growth of G20 countries from 2020 to 2024, by country (2025). Statista. Available at: https://www.statista.com/statistics/1468449/gdp-growth-g20-countries/ (Accessed 20 January 2025)
Hutchinson, J. and Mee, S. (2025). The impact of the ECB’s monetary policy measures taken in response to the COVID-19 crisis. European Central Bank. Available at: https://www.ecb.europa.eu/press/economic-bulletin/focus/2020/html/ecb.ebbox202005_03~12b5ff68bf.en.html (Accessed 4 February 2025)
Interest Rate G20 countries (2025). Trading Economics. Available at: https://tradingeconomics.com/country-list/interest-rate?continent=g20 (Accessed 4 February 2025)
Macrotrends (2025). S&P 500 Index – 90 Year Historical Chart. Available at: https://www.macrotrends.net/2324/sp-500-historical-chart-data (Accessed 04 February 2025)
Organization for Economic Cooperation and Development (2025). Business Confidence Index (BCI) – G20 vs USA. Available at: https://www.oecd.org/en/data/indicators/business-confidence-index-bci.html?oecdcontrol-cf46a27224-var1=G20%7CUSA
Rugaber, C (2024). ‘Wealthier Americans are driving retail spending and powering US economy’, The Associated Press, 18 October. Available at: https://apnews.com/article/economy-consumers-inflation-retail-spending-growth-wealth-be68f97bba5970ed4ce4fc8b8c7333af (Accessed 28 January 2025)
Saez, E. and Michaillat, P. (2022). Figuring out efficient unemployment. The VoxEU Column, 19 April. Available at: https://cepr.org/voxeu/columns/figuring-out-efficient-unemployment (Accessed 2 February 2025)
U.S. Bureau of Labor Statistics (2025). Consumer Price Index. Available at: https://www.bls.gov/charts/consumer-price-index/consumer-price-index-by-category-line-chart.htm (Accessed 04 February 2025)
U.S. Department of Labor. How is the consumer price index (CPI) used. Available at: https://webapps.dol.gov/dolfaq/go-dol-faq.asp?faqid=92&topicid=6&subtopicid=116 (Accessed 04 February 2025)
Unemployment rate G20 countries (2025). Trading Economics. Available at: https://tradingeconomics.com/country-list/unemployment-rate?continent=g20 (Accessed 02 February 2025)


Leave a comment